We began by comparing the « Cloudy » and « Meudon-PDR » codes to test their behaviours in the case of X-ray radiation. This work allowed our postdoctoral researcher to become familiar and consolidate her expertise with these codes. These efforts allowed us to choose the code best suited to our needs (and available data). We then studied two excitation mechanisms: (i) X-rays and (ii) cosmic rays. We produced numerous grids of models to cover typical excitation conditions in filaments. All grids are available. We also verified that we were able to reproduce the results of recent state-of-the-art studies, which represent only a subset of the models that we had produced. We then explored a new dimension: radiative transfer within the cloud was taken into account, whereas current idealised models consider only emission from the surface of gas clouds (Polles et al., 2021). This new parameter space enabled us to find good solutions with X-rays self irradiated clouds, in agreement with the observational constraints. We initiated the creation of new grids of molecular shock models using the Paris-Durham shock code (Lesaffre et al., 2013), adapted for strong radiation fields (Godard et al., 2019). We have compared these results with a rich set of multi-wavelengths spectroscopic data from the Perseus cluster (Polles et al., in prep) which confirms that the X-rays (rather than Cosmic Rays) excitation reproduce the observations very well.
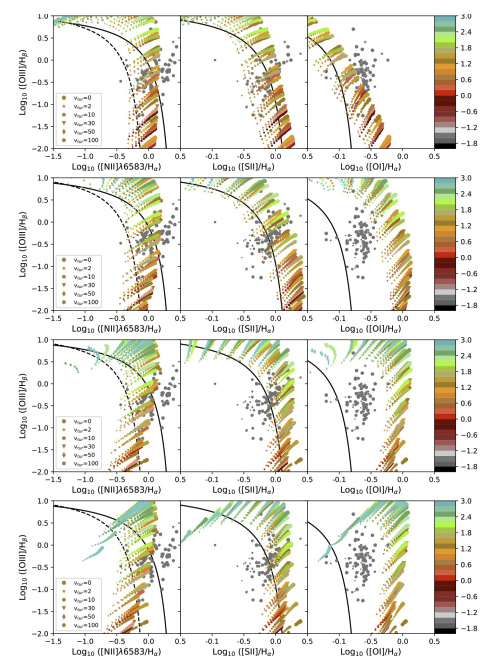
Figure : BPT diagrams. The gray dots (filament values) and the stars (nucleus values) represent the data from Mcdonald et al. (2012). The size of the dots decreases with increasing distance of the corresponding object from the nuclei. The solid black line is the upper limit for HII regions by Kewley et al. (2001) and the dashed black line is the lower limit for AGNs by Kauffmann et al. (2003). The predicted cumulative line ratios from the models are overlapped. The color bar corresponds to the different values of GX (the logarithm of the value is written on the bar); each symbol corresponds to one turbulence value and the size of the symbols increases with the metallicity (from 0.3 to 1 Z). Top row: cumulative emission at AV = 0.001 mag; second row: cumulative emission at AV = 0.1 mag; third row: cumulative emission at AV = 1 mag; bottom row: cumulative emission at AV = 5 mag. Left column: [O iii]λ 5007 Å/Hβ vs. [N ii]λ 6583 Å/Hα; central column: [O iii]λ 5007 Å/Hβ vs. [S ii]/Hα; right column: [O iii]λ 5007 Å/Hβ vs. [O i]/Hα.